 Catalogue PIGMA
IFREMER / STATION PORT EN BESSIN
Type of resources
Available actions
Topics
Keywords
Contact for the resource
Provided by
Years
Representation types
Resolution
-
This gridded product visualizes 1960 - 2014 water body ammonium concentration (umol/l) in the North Sea domain, for each season (winter: December – February; spring: March – May; summer: June – August; autumn: September – November). It is produced as a Diva 4D analysis, version 4.6.9: a reference field of all seasonal data between 1960-2014 was used; results were logit transformed to avoid negative/underestimated values in the interpolated results; error threshold masks L1 (0.3) and L2 (0.5) are included as well as the unmasked field. Every step of the time dimension corresponds to a 10-year moving average for each season. The depth dimension allows visualizing the gridded field at various depths.
-
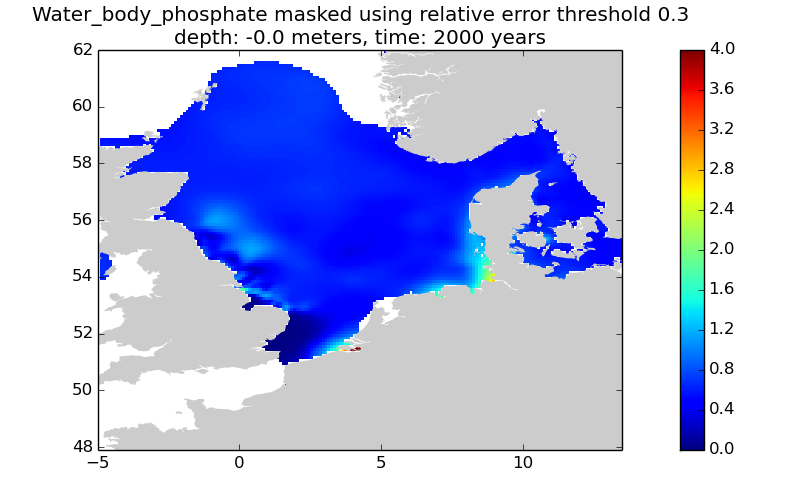
This gridded product visualizes 1960 - 2014 water body phosphate concentration (umol/l) in the North Sea domain, for each season (winter: December – February; spring: March – May; summer: June – August; autumn: September – November). It is produced as a Diva 4D analysis, version 4.6.9: a reference field of all seasonal data between 1960-2014 was used; results were logit transformed to avoid negative/underestimated values in the interpolated results; error threshold masks L1 (0.3) and L2 (0.5) are included as well as the unmasked field. Every step of the time dimension corresponds to a 10-year moving average for each season. The depth dimension allows visualizing the gridded field at various depths.
-
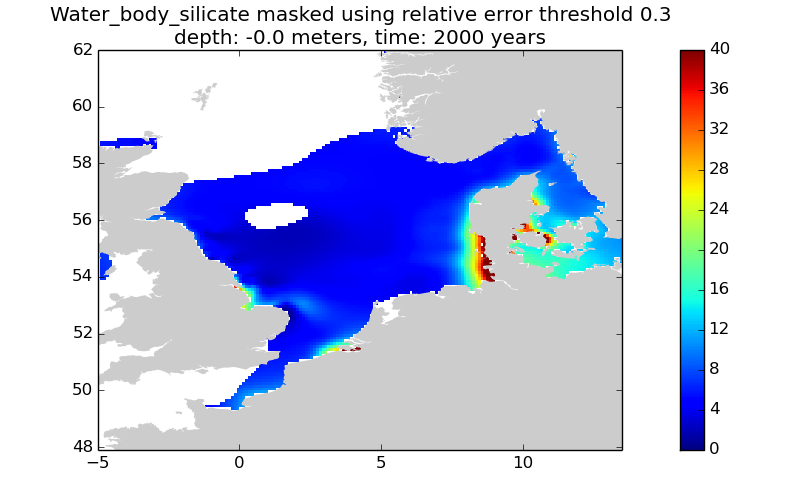
This gridded product visualizes 1960 - 2014 water body silicate concentration (umol/l) in the North Sea domain, for each season (winter: December – February; spring: March – May; summer: June – August; autumn: September – November). It is produced as a Diva 4D analysis, version 4.6.9: a reference field of all seasonal data between 1960-2014 was used; results were logit transformed to avoid negative/underestimated values in the interpolated results; error threshold masks L1 (0.3) and L2 (0.5) are included as well as the unmasked field. Every step of the time dimension corresponds to a 10-year moving average for each season. The depth dimension allows visualizing the gridded field at various depths.
-
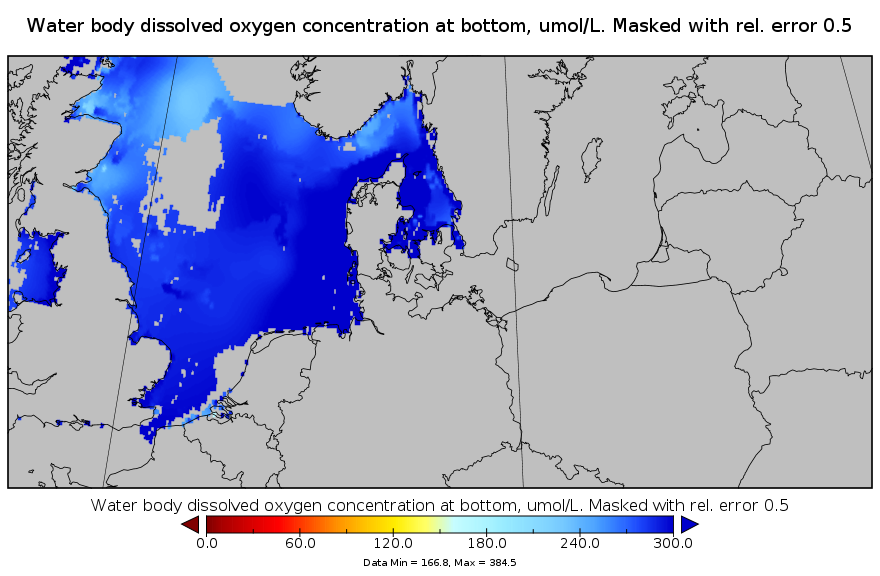
This gridded product visualizes 1960 - 2014 water body dissolved oxygen concentration (umol/l) in the North Sea domain, for each season (winter: December – February; spring: March – May; summer: June – August; autumn: September – November). It is produced as a Diva 4D analysis, version 4.6.11: a reference field of all seasonal data between 1960-2014 was used; results were logit transformed to avoid negative/underestimated values in the interpolated results; error threshold masks L1 (0.3) and L2 (0.5) are included as well as the unmasked field. Every step of the time dimension corresponds to a 10-year moving average for each season. The depth dimension allows visualizing the gridded field at various depths.
-
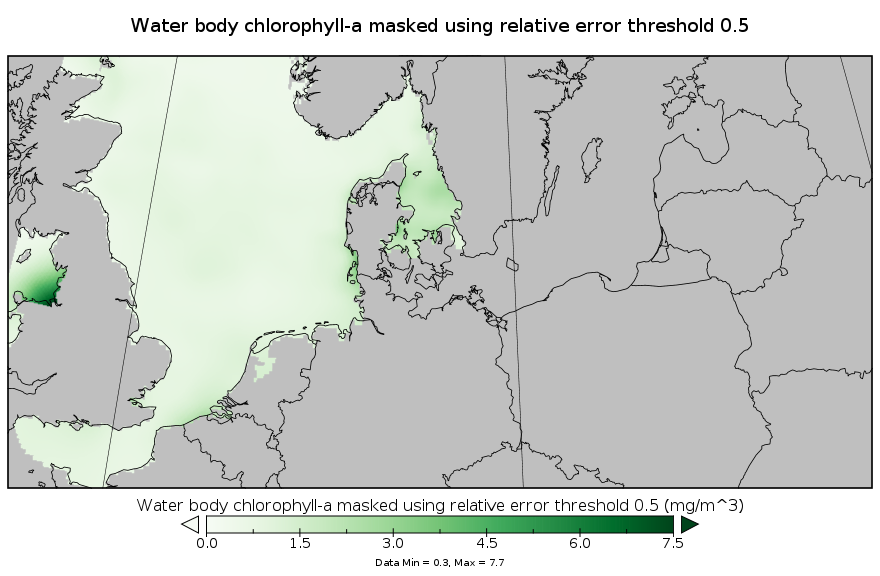
This gridded product visualizes 1960 - 2014 water body chlorophyll-a (mg/m^3) in the North Sea domain, for each season (winter: December – February; spring: March – May; summer: June – August; autumn: September – November). It is produced as a Diva 4D analysis, version 4.6.11: a reference field of all seasonal data between 1960-2014 was used; results were logit transformed to avoid negative/underestimated values in the interpolated results; error threshold masks L1 (0.3) and L2 (0.5) are included as well as the unmasked field. Every step of the time dimension corresponds to a 10-year moving average for each season. The depth dimension allows visualizing the gridded field at various depths.
-
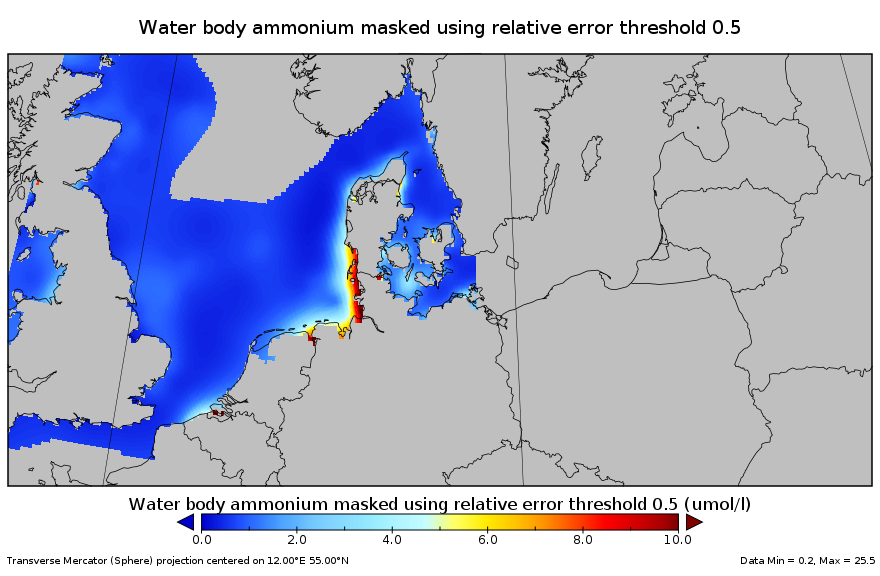
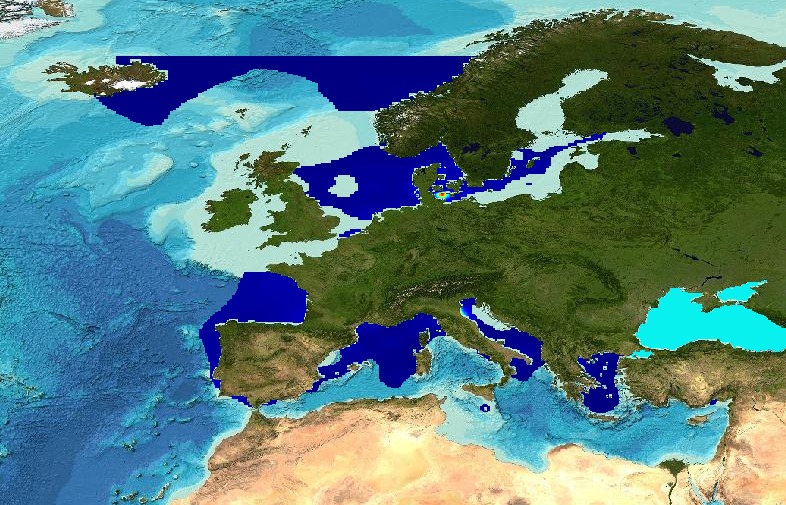
Combined product of Water body ammonium based on DIVA 4D 10-year analysis on five regions : Northeast Atlantic Ocean, North Sea, Baltic Sea, Black Sea, Mediterranean Sea. The boundaries and overlapping zones between these five regions were filtered to avoid any unrealistic spatial discontinuities. This combined Water body ammonium product is masked using the relative error threshold 0.5. Units: umol/l.
-
Combined product of Water body phosphate based on DIVA 4D 10-year analysis on five regions : Northeast Atlantic Ocean, North Sea, Baltic Sea, Black Sea, Mediterranean Sea. The boundaries and overlapping zones between these five regions were filtered to avoid any unrealistic spatial discontinuities. This combined water body phosphate product is masked using the relative error threshold 0.5. Units: umol/l
-
Combined product of Water body silicate based on DIVA 4D 10-year analysis on five regions : Northeast Atlantic Ocean, North Sea, Baltic Sea, Black Sea, Mediterranean Sea. The boundaries and overlapping zones between these five regions were filtered to avoid any unrealistic spatial discontinuities. This combined water body silicate product is masked using the relative error threshold 0.5. Units: umol/l
-
The analysis was performed per season using DIVA software tool (Data-Interpolating Variational Analysis). The analyses products are stored as NetCDF CF files and made available as WMS layers for easy browsing and adding. Every step of the time dimension corresponds to a 6-year moving average from 1983 to 2016. The depth dimension spans from surface to 1000 m, with 21 vertical levels. The boundaries and overlapping zones between these regions were filtered to avoid any unrealistic spatial discontinuities. This combined water body dissolved oxygen concentration product is masked using the relative error threshold 0.5. Units: µmol/l Created by 'University of Liège, GeoHydrodynamics and Environment Research (ULiège-GHER)'. The data used as input for DIVA have been extracted from the EMODnet Chemistry Download Service: https://emodnet-chemistry.maris.nl/search Intermediate regional data products: Mediterranean Sea - DIVA 4D 6-year analysis of Water body chlorophyll-a 1990/2017 v2018, Arctic Ocean - DIVA 4D 6-year analysis of Water body chlorophyll-a 1980/2017 v2018, Black Sea - DIVA 4D 6-year analysis of Water body chlorophyll-a 1990/2016 v2018, North East Atlantic Ocean - DIVA 4D 6-year analysis of Water body chlorophyll-a 1960/2017 v2018, North Sea - DIVA 4D 6-year analysis of Water body chlorophyll-a 1980/2017 v2018, Baltic Sea - DIVA 4D 6-year analysis of Water body chlorophyll-a 1980/2016 v2018
-
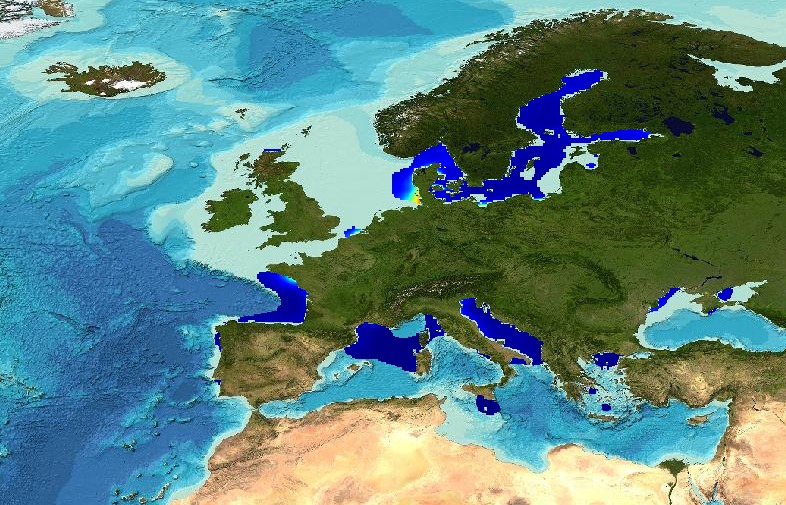
The analysis was performed per season using DIVA software tool (Data-Interpolating Variational Analysis). The analyses products are stored as NetCDF CF files and made available as WMS layers for easy browsing and adding. Every step of the time dimension corresponds to a 6-year moving average from 1983 to 2016. The depth dimension spans from surface to 1000 m, with 21 vertical levels. The boundaries and overlapping zones between these regions were filtered to avoid any unrealistic spatial discontinuities. This combined water body dissolved oxygen concentration product is masked using the relative error threshold 0.5. Units: µmol/l Created by 'University of Liège, GeoHydrodynamics and Environment Research (ULiège-GHER)'. The data used as input for DIVA have been extracted from the EMODnet Chemistry Download Service: https://emodnet-chemistry.maris.nl/search Intermediate regional data products: Mediterranean Sea - DIVA 4D 6-year analysis of Water body dissolved inorganic nitrogen (DIN) 1990/2016 v2018, North Sea - DIVA 4D 6-year analysis of Water body dissolved inorganic nitrogen (DIN) 1980/2017 v2018, Black Sea - DIVA 4D 6-year analysis of Water body dissolved inorganic nitrogen (DIN) 1990/2016 v2018, North East Atlantic Ocean - DIVA 4D 6-year analysis of Water body dissolved inorganic nitrogen (DIN) 1984/2017 v2018, Baltic Sea - DIVA 4D 6-year analysis of Water body dissolved_inorganic_nitrogen_(DIN) 1980/2016 v2018